> ## Documentation Index
> Fetch the complete documentation index at: https://docs.datadash.xyz/llms.txt
> Use this file to discover all available pages before exploring further.
# Activity
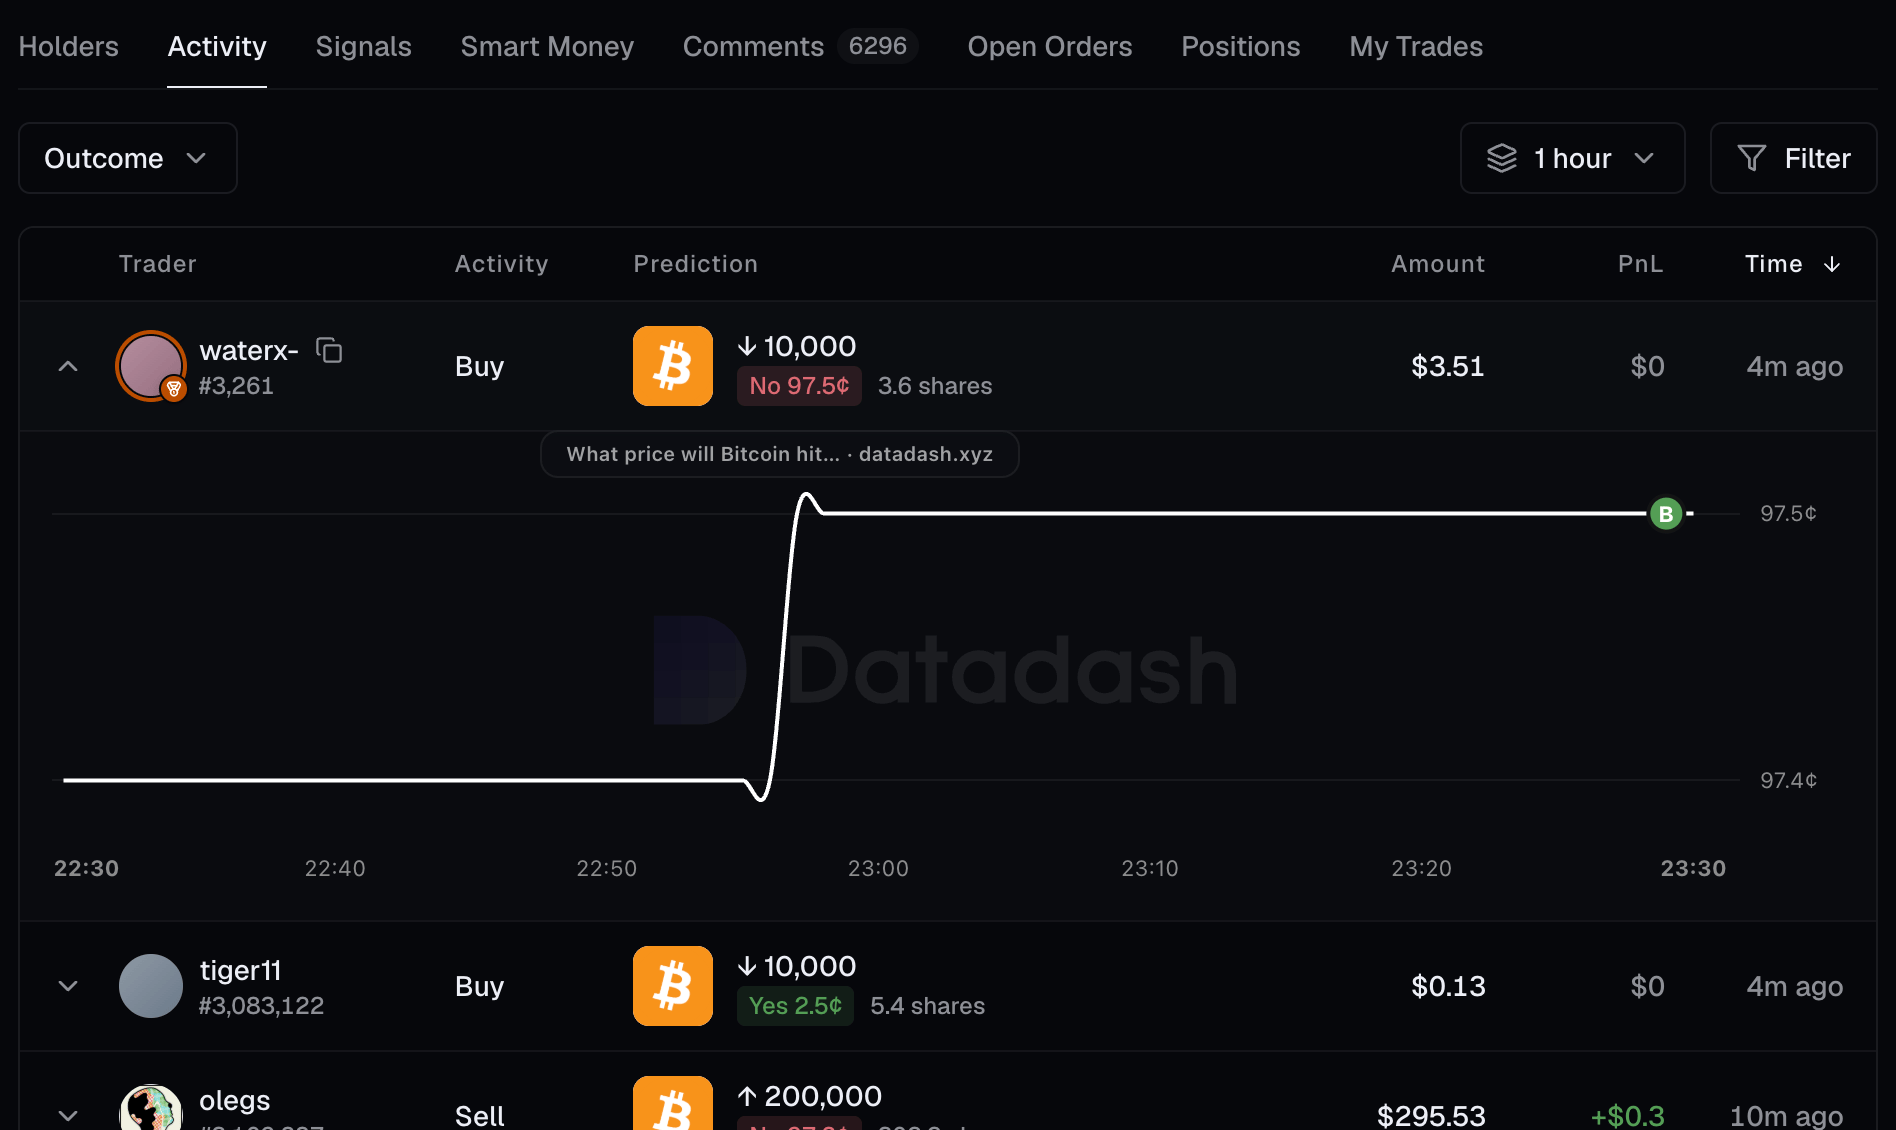
> Every prediction-market fill, enriched with market, event and category metadata.
Activity is the chronological log of prediction-market trades. Every row is a single fill — one wallet buying or selling one position — already joined to the market, event, category and series it belongs to, so you don't have to resolve identifiers yourself.
The same endpoint also returns a **summary** view, grouping fills into time buckets when you don't want the raw log.
 ## Columns
| Column | Meaning |
| --------------------------- | ----------------------------------------------------------- |
| **`activity`** | The type of activity: a buy or a sell. |
| **`timestamp`** | When the fill occurred. |
| **`wallet`** | The wallet that traded. |
| **`amount`** | Shares bought or sold. |
| **`usdPrice`** | Price per share, in USD. |
| **`usdAmount`** | USD value of the fill. |
| **`avgBuyingPrice`** | The wallet's average buying price at the time of this fill. |
| **`realizedPnl`** | Realized profit and loss, in USD. |
| **`realizedPnlPercentage`** | Realized PnL as a percentage of cost basis. |
| **`positionId`** | The position traded. |
| **`marketId`** | The market the fill happened in. |
| **`eventId`** | The parent event of that market. |
| **`tagIds`** | Categories on the event. |
| **`seriesId`** | The series the event belongs to. |
| **`txHash`** | On-chain transaction hash. |
| **`seqId`** | Sequence id, for stable ordering. |
The identifier columns are what make the log *enriched*: `marketId`, `eventId`, `tagIds` and `seriesId` come resolved on every row, so you can group or filter by market, event or category without a second lookup.
## Two ways to read it
### The log
By default the endpoint returns **one row per fill**, newest first.
```json theme={null}
{
"page": { "limit": 50 },
"filter": [
{ "field": "wallet", "operator": "eq", "value": "0xAb8D...90F1" }
]
}
```
### The summary
Pass `aggregationWindow` to roll fills up into time buckets. Rows are grouped by **bucket, activity type, wallet and position** — one row per wallet's buying (or selling) of one position within one window.
```json theme={null}
{
"page": { "limit": 50 },
"aggregationWindow": 4,
"activityIds": [1],
"filter": [
{ "field": "wallet", "operator": "eq", "value": "0xAb8D...90F1" }
]
}
```
Grains run from hourly to monthly; the API Reference lists the id for each. Omit the field for the raw log.
Measures are aggregated the way each one means something: `amount`, `usdAmount` and `realizedPnl` are **summed**, while `usdPrice` and `avgBuyingPrice` are **share-weighted averages** — not plain averages, so a large fill counts more than a small one. `marketId`, `eventId`, `tagIds` and `seriesId` carry through as representative values for the group.
## Selecting activity types
`activityIds` restricts the log to buys or sells. Activity type isn't part of `filter` — it's selected here.
```json theme={null}
{ "page": { "limit": 50 }, "activityIds": [1] }
```
All types are returned when omitted. See [Filtering](/filters#activity-options) for how these fields interact with the rest of the request.
## Filtering and search
Filter on wallet, market, event, category, position, timestamp, and the numeric measures — see [Filtering](/filters) for the syntax. `searchKey` runs a free-text search over markets, combining semantic and keyword relevance, so you can find activity by what a market is about rather than by id.
```json theme={null}
{
"page": { "limit": 50 },
"searchKey": "election",
"filter": [
{ "field": "usdAmount", "operator": "gte", "value": 1000 }
],
"orderBy": [{ "field": "timestamp", "direction": "desc" }]
}
```
## API endpoint
`POST /api/v1/activity`: chronological log of buys and sells, or a bucketed summary.
## Columns
| Column | Meaning |
| --------------------------- | ----------------------------------------------------------- |
| **`activity`** | The type of activity: a buy or a sell. |
| **`timestamp`** | When the fill occurred. |
| **`wallet`** | The wallet that traded. |
| **`amount`** | Shares bought or sold. |
| **`usdPrice`** | Price per share, in USD. |
| **`usdAmount`** | USD value of the fill. |
| **`avgBuyingPrice`** | The wallet's average buying price at the time of this fill. |
| **`realizedPnl`** | Realized profit and loss, in USD. |
| **`realizedPnlPercentage`** | Realized PnL as a percentage of cost basis. |
| **`positionId`** | The position traded. |
| **`marketId`** | The market the fill happened in. |
| **`eventId`** | The parent event of that market. |
| **`tagIds`** | Categories on the event. |
| **`seriesId`** | The series the event belongs to. |
| **`txHash`** | On-chain transaction hash. |
| **`seqId`** | Sequence id, for stable ordering. |
The identifier columns are what make the log *enriched*: `marketId`, `eventId`, `tagIds` and `seriesId` come resolved on every row, so you can group or filter by market, event or category without a second lookup.
## Two ways to read it
### The log
By default the endpoint returns **one row per fill**, newest first.
```json theme={null}
{
"page": { "limit": 50 },
"filter": [
{ "field": "wallet", "operator": "eq", "value": "0xAb8D...90F1" }
]
}
```
### The summary
Pass `aggregationWindow` to roll fills up into time buckets. Rows are grouped by **bucket, activity type, wallet and position** — one row per wallet's buying (or selling) of one position within one window.
```json theme={null}
{
"page": { "limit": 50 },
"aggregationWindow": 4,
"activityIds": [1],
"filter": [
{ "field": "wallet", "operator": "eq", "value": "0xAb8D...90F1" }
]
}
```
Grains run from hourly to monthly; the API Reference lists the id for each. Omit the field for the raw log.
Measures are aggregated the way each one means something: `amount`, `usdAmount` and `realizedPnl` are **summed**, while `usdPrice` and `avgBuyingPrice` are **share-weighted averages** — not plain averages, so a large fill counts more than a small one. `marketId`, `eventId`, `tagIds` and `seriesId` carry through as representative values for the group.
## Selecting activity types
`activityIds` restricts the log to buys or sells. Activity type isn't part of `filter` — it's selected here.
```json theme={null}
{ "page": { "limit": 50 }, "activityIds": [1] }
```
All types are returned when omitted. See [Filtering](/filters#activity-options) for how these fields interact with the rest of the request.
## Filtering and search
Filter on wallet, market, event, category, position, timestamp, and the numeric measures — see [Filtering](/filters) for the syntax. `searchKey` runs a free-text search over markets, combining semantic and keyword relevance, so you can find activity by what a market is about rather than by id.
```json theme={null}
{
"page": { "limit": 50 },
"searchKey": "election",
"filter": [
{ "field": "usdAmount", "operator": "gte", "value": 1000 }
],
"orderBy": [{ "field": "timestamp", "direction": "desc" }]
}
```
## API endpoint
`POST /api/v1/activity`: chronological log of buys and sells, or a bucketed summary.