> ## Documentation Index
> Fetch the complete documentation index at: https://docs.datadash.xyz/llms.txt
> Use this file to discover all available pages before exploring further.
# Smart Money
> Where the top wallets are positioned across every market.
Smart Money ranks markets by the gap between where a cohort of top wallets is positioned and the live market price. It surfaces the markets where the sharpest traders most disagree with the crowd, so you can see conviction before it shows up in the odds.
## The global view
The main table lists every market the selected cohort holds, ranked by edge. Each row shows the cohort's implied outcome and price next to the live market price (for example, `Yes 2.8¢ vs smart money 100¢`).
| Column | Meaning |
| ------------- | ------------------------------------------------------------------------------------------------------------------------ |
| **Edge** | Distance between the smart-money implied Yes probability and the live Yes price. Larger edge means a wider disagreement. |
| **At Risk** | Total USD the selected wallets hold in this market. |
| **Liquidity** | The market's on-book liquidity. |
| **Wallets** | Distinct wallets from the selected set holding this market. |
| **Days Left** | Whole days until the market's end date. |
Use the cohort selector (for example, **Top 1,000**) to change which wallet set defines "smart money". Any [cohort](/cohorts) can be used here, including your own.
## The market view
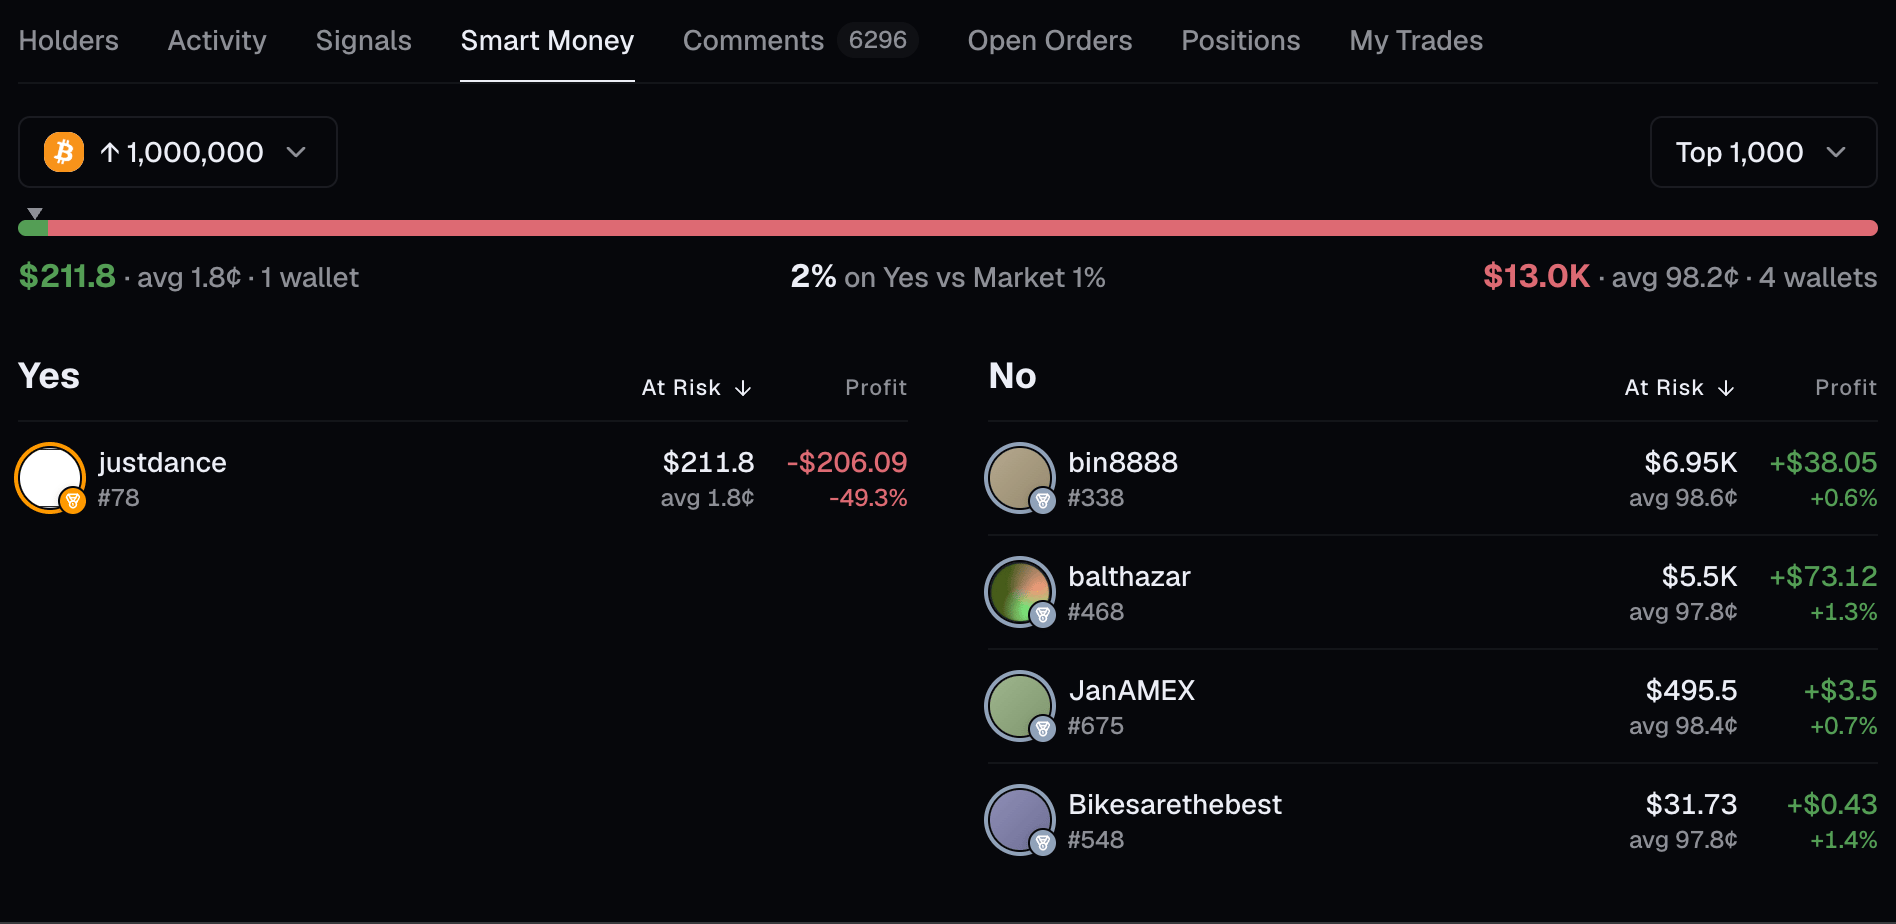
Open a market to see how the cohort is split across outcomes. A Yes/No bar compares **Smart Money Odds** (the cohort's value-weighted probability) against **Market Odds** (the live price), and each side lists the individual wallets with their average entry price, amount **At Risk**, and open **Profit**.
 Multi-outcome (neg-risk) events are handled separately, canonicalizing each wallet's true bet across the event's outcomes so the Yes and No sides stay comparable.
## API endpoints
`POST /api/v1/smart-money/global`: markets ranked by edge across the selected wallets.
`POST /api/v1/smart-money/summary`: Yes/No summary of held positions for one market.
`POST /api/v1/smart-money/positions`: per-wallet positions on one binary market.
`POST /api/v1/smart-money/neg-risk/summary` and `/neg-risk/positions` for multi-outcome events.
Multi-outcome (neg-risk) events are handled separately, canonicalizing each wallet's true bet across the event's outcomes so the Yes and No sides stay comparable.
## API endpoints
`POST /api/v1/smart-money/global`: markets ranked by edge across the selected wallets.
`POST /api/v1/smart-money/summary`: Yes/No summary of held positions for one market.
`POST /api/v1/smart-money/positions`: per-wallet positions on one binary market.
`POST /api/v1/smart-money/neg-risk/summary` and `/neg-risk/positions` for multi-outcome events.