

How Smart Money works
What counts as smart money, how wallets turn into odds and Edge, and when smart money gets it wrong, with a worked example.
The global view
The main table lists every market the selected cohort holds, ranked by edge. Each row shows the cohort’s implied outcome and price next to the live market price (for example,Yes 2.8¢ vs smart money 100¢).
Use the cohort selector (for example, Top 1,000) to change which wallet set defines “smart money”. Any cohort can be used here, including your own.
The market view
Open a market to see how the cohort is split across outcomes. A Yes/No bar compares Smart Money Odds (the cohort’s value-weighted probability) against Market Odds (the live price), and each side lists the individual wallets with their average entry price, amount At Risk, and open Profit.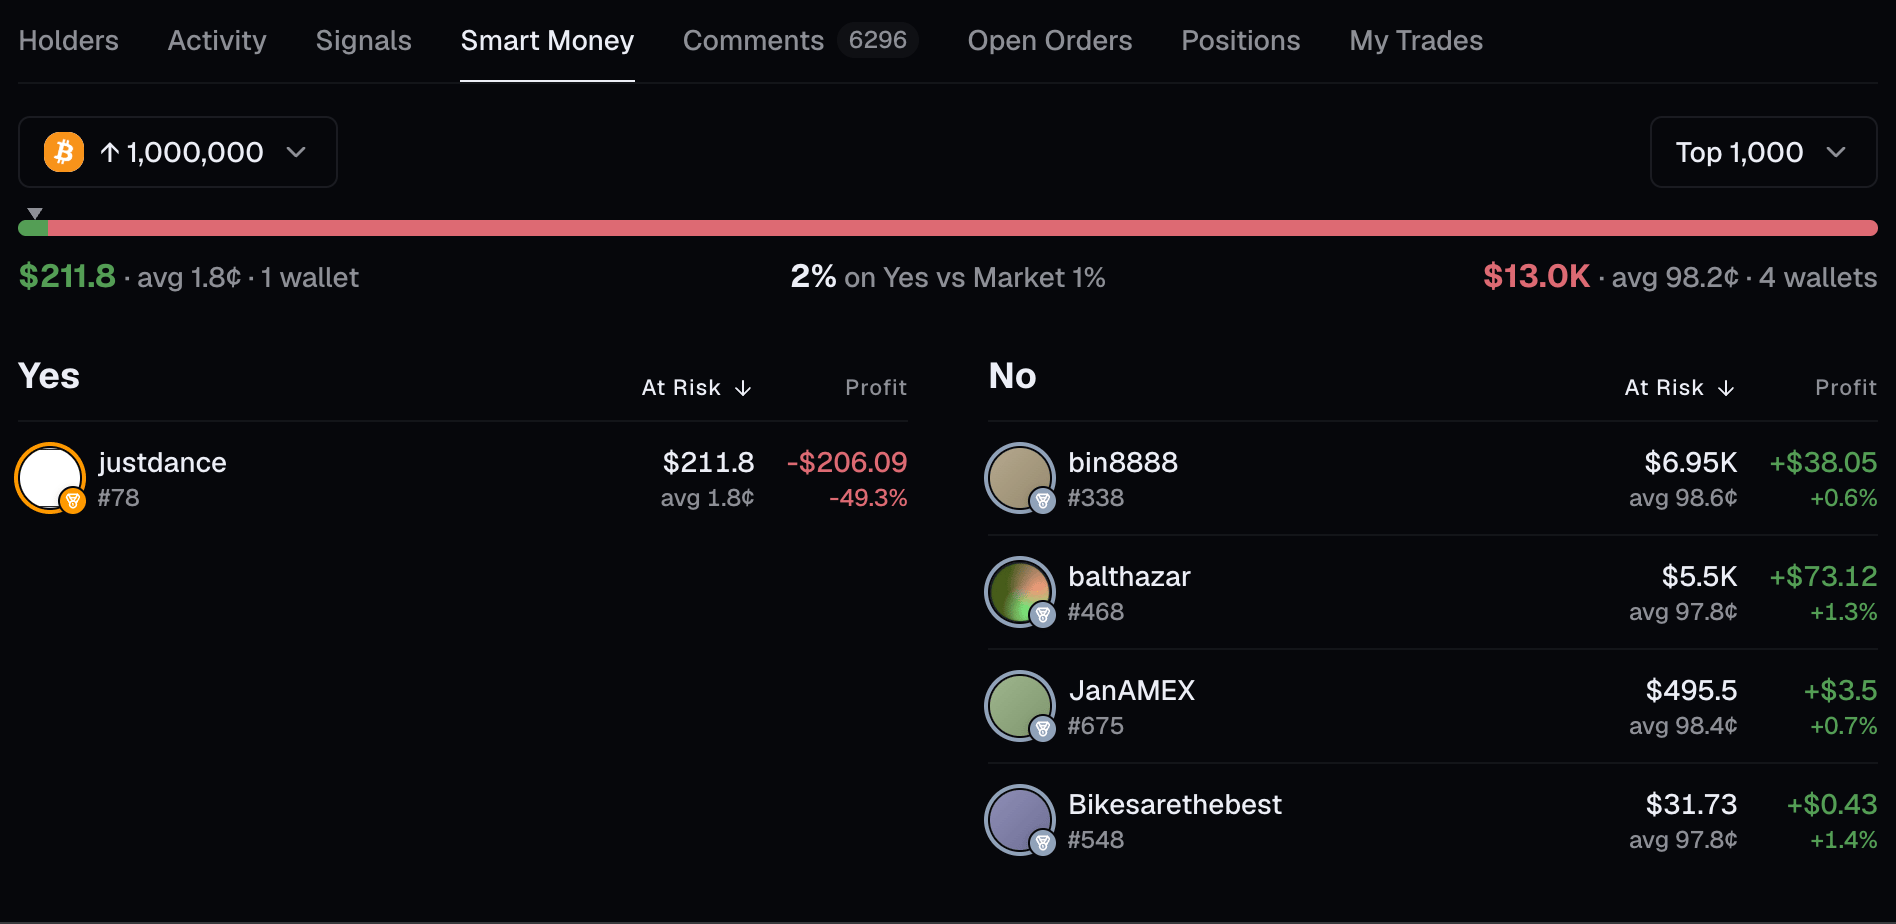
The market view for a Top 1,000 cohort: smart-money odds against the live price, with the wallets on each side.
API endpoints
Global Smart Money
POST /api/v1/smart-money/global: markets ranked by edge across the selected wallets.Smart Money Summary
POST /api/v1/smart-money/summary: the Yes/No summary of an event, one row per open market, for binary and multi-outcome events alike.Smart Money Holders
POST /api/v1/smart-money/holders: the wallets holding one side of one market within an event.